Human Demography

We are using the site frequency spectrum to model the demographic histories of European and Asian populations.

With Dr. Kirk Lohmueller (UCLA), I am estimating demographic parameters for European and Asian populations, based on a two-dimensional site Carnacfrequency spectrum (SFS) from 564 Danish and Han Chinese individuals. I am using a maximum-likelihood coalescent approach in the program fastsimcoal2 (Excoffier et al. 2013) to estimate parameters for the divergence time between the two populations, historical population sizes,bottlenecks and the timing and rates of growth.
See other Current Projects

Sea Otter Population Genomics

We will sequence the sea otter genome to assess the effects of the fur trade bottleneck on genomic diversity and genetic load.

GL_GRID

Forward-in-time Poisson Random Field simulations demonstrating how sea otter genetic load (decrease in fitness to due harmful alleles) may have increased due to the fur trade population bottleneck.

Sea otters were hunted to near-extinction during the 18th-19th centuries. Only six remnant populations of fewer than 100 individuals survived, many of which have recovered dramatically over the past century. With Bob Wayne (UCLA), Kirk Lohmueller (UCLA), Klaus-Peter Koepfli (Smithsonian Conservation Biology Institute) and James Estes (UC Santa Cruz), I am developing a project to sequence the de novo sea otter genome and combine ancient and modern sea otter genomic data from across the species’ range to assess the effect of this extreme bottleneck on the sea otter genome. I am currently carrying out forward-in-time simulations based on population histories drawn from the literature to model the effect of the fur trade bottleneck on genetic diversity and genetic load (decrease in fitness due to harmful genetic variants) in sea otter populations.

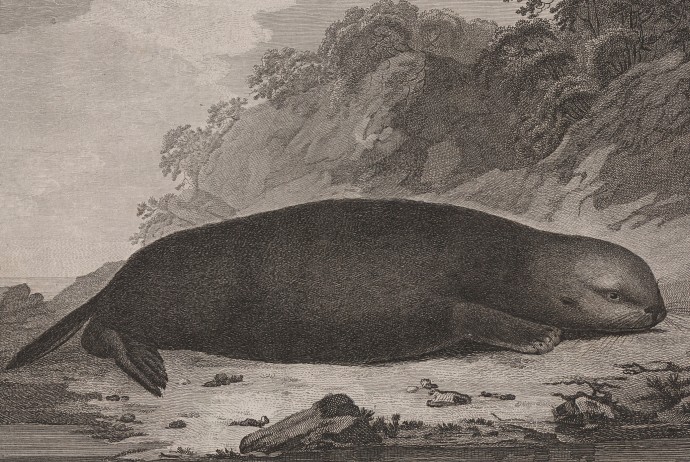
[The featured image is artist John Webber’s “Sea Otter” c. 1780, based on his observations as a member of Captain Cook’s third Pacific voyage.]

See other Current Projects

SCaLE Genetics & Genomics Meeting

I visited UC Riverside’s beautiful campus this Saturday (4/11) for the Southern California Evolutionary Genetics & Genomics meeting. It was a fantastic venue for graduate students, post-docs and faculty to chat informally and to hear some fascinating talks from across evolutionary genetics. I heartily recommend this (free!) meeting to any evolutionary geneticists in SoCal.

UC Riverside

I was particularly interested in Dr. Melissa Sayres talk about a dip in male Y chromosomal diversity around the time agriculture was introduced into different human populations, which could possibly be explained by an increase in variance of male reproductive success due to a more stratified society.


NSF GRFP

I am so excited to say that I’ve received an NSF Pre-doc (GRFP) fellowship, giving me three years of funding! I am developing a sea otter genomics project, including sequencing the Enhydra lutris genome de novo and using low-coverage resequencing to gather SNP data across the species’ range. I plan to estimate the species’ demographic history using a coalescent approach and determine whether certain populations have accumulated deleterious alleles after the extreme population bottleneck due to the fur trade.


Science Olympiad

I had a fantastic time volunteering at the regional Science Olympiad competition at Occidental College last Saturday.

Starting in sixth grade, I was an avid participant in Science OlympSO_logoiad, competing every year until I graduated from high school. I think these competitions provide remarkable opportunities for students to experience broader fields of science than the biology/chemistry/physics they learn in school. They can try their hands at engineering events (building trebuchets and bottle rockets) or become experts in astronomy, paleontology, forensics, and experimental design as they prepare for the knowledge events.

I think it gives them the best insights into different science careers, giving them a chance to  see how science can be used to answer real-world problems in a myriad of careers.

This was my first time on the supervising side of the competition, and I was thrilled to see so many passionate kids from all walks of life there to meet and compete with their fellow science gtentseeks.

I was the event supervisor for the middle school “Green Generation” event — a knowledge test covering topics in ecology, evolution and environmental science. This event is a spin-off of an event I competed in back in the day (“Water Quality”) in which I wrote an entire essay about eutrophication without being entirely sure what it was. (Came in third, so not so bad!)

First time supervising

First time supervising

Many of these kids were perfectly aware of the definition and implications of eutrophication, along with a host of other environmental threats to aquatic and terrestrial ecosystems. The event was an excellent way to give students a grounding in environmental science while educating them about ways they can contribute to local solutions.

Thanks so much to everyone at Caltech and Occy for organizing this wonderful event — it is such a pleasure to be back!

Exploring Your Universe: Strawberry DNA

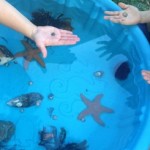
I had a fantastic time volunteering at the “Exploring Your Universe” event at UCLA this Sunday. Allison Fritts-Penniman and Johnathan Chang organized two great booths for the EEB department: a strawberry DNA extraction using soap and rubbing alcohol and a marine invertebrate touch-tank. During my shift, I taught children ages 4-18 about the concepts of DNA and the genetic code and led them through the simple extraction process. For some of the younger kids, the concept of DNA was a bit too abstract, but they still enjoyed getting to do some hands-on science by adding dish soap to strawberry puree, then watching the DNA precipitate into the isopropanol. Older children were more engaged with the actual concepts; one ten year old boy asked increasingly insightful questions as he began to understand the importance of DNA in heredity and evolution, and I was able to talk him through how DNA is an indicator of relatedness between individuals and of phylogenetic relatedness between species.

The best thing about the strawberry DNA protocol is that it can easily be done at home, and so I suggested that parents and their children carry out experiments to see what else they can extract DNA from (onion, banana, cheek swabs, etc.). The main advantage of using store-bought strawberries is that they are octoploid (eight copies of their chromosome set, as opposed to our two copies) making the quantity of DNA extracted very high and therefore easy to visualize, so I warned participants that other organisms they try to extract DNA from may not give such generous yields.

I highly recommend this simple DNA extraction protocol for teachers and parents — when I was in middle school, I carried out this protocol on a piece of onion at a family science workshop and became deeply fascinated with DNA and genetics. Hopefully some of the kids on Sunday were just as inspired!

Fastsimcoal2

I am currently using fastsimcoal2 to model European and Asian demography.

A relatively recent development in population genetics is the use of maximum likelihood approaches to estimate demographic parameters from the site frequency spectrum (SFS). The SFS gives the number of SNPs observed at given frequencies in a sample. The distribution of these frequencies is affected by the demographic history of the population. For example, population expansion leads to long external branches on coalescent trees and consequently to an abundance of low-frequency variants. Population contraction leads to long internal coalescent branches and a skew toward intermediate frequency variants. Programs such as fastsimcoal2 (Excoffier et al. 2013) have developed methods to estimate the likelihood of an observed SFS under a particular set of demographic parameters.

fastsimcoal2 uses a maximum likelihood approach to estimate demographic parameters from the site frequency spectrum. The user provides a template file describing the proposed model in terms of the parameters to be estimated. The program selects a set of parameters at random (within ranges set by the user) and proceeds to carry out coalescent simulations based on the model in order to determine the composite likelihood of observing the given site frequency spectrum under that model. For a set of parameters, repeated coalescent trees are drawn. Using methods detailed in Nielsen (2000), fastsimcoal2 calculates the proportion of branch lengths on a coalescent tree that lead to ‘i’ nodes in the present day. This portion of the tree represents the probability of a SNP appearing in ‘i’ chromosomes in the sample. By repeating this estimation over Z simulations (at least 100,000x) for each value of ‘i,’ fastsimcoal2 calculates an arbitrarily precise estimator which can be used in composite likelihood calculations.

Using the Brent Algorithm, fastsimcoal2 then optimizes each parameter over repeated cycles (20-40 “ECM cycles”) to determine which parameter values maximize the likelihood estimate of the observed SFS under the proposed model.

These simulations can be carried out on a 1D SFS (one population), or a joint SFS for 2 or more populations.

My biggest tip is that you have to be extremely careful with the formatting of the site frequency spectrum you use as input. It must say “1 observation” (and nothing else) in the line above your SFS to be recognized as an SFS; if not, all the likelihood values you get will be 0.000. This isn’t explicit in the manual, so beware. More tips to come!

Sources Cited:

Excoffier, L., Dupanloup, I., Huerta-Sánchez, E., Sousa, V. C., & Foll, M. (2013). Robust demographic inference from genomic and SNP data. PLoS genetics, 9(10), e1003905.

Nielsen, R. (2000). Estimation of population parameters and recombination rates from single nucleotide polymorphisms. Genetics, 154(2), 931-942.